Prometheus (프로메테우스) 설치
[Kubernetes Monitoring 관련 글 목록]
Kubernetes Monitoring : Metrics
Kubernetes Monitoring : HAP
Kubernetes Monitoring : Prometheus 개념
Kubernetes Monitoring : Prometheus 설치
Kubernetes Monitoring : Grafana
Kubernetes Cluster에 Prometheus를 구성해봄.
Helm이 설치된 상태에서 진행함.
Helm 설치가 안되어있다면 설치 해줘야함.
1. Prometheus Helm Chart Download
[명령어]
git clone https://github.com/kubernetes/charts
cd charts/stable/prometheus
[결과]

2. Prometheus Volume 설정 변경
실제 운영환경에서는
alertmanager 와 Prometheus-Server Deployment에서
PVC를 사용하는 것을 추천함.
PV와 PVC를 생성하지 않고 helm 설치를 진행하면 상위 그림과 같이 Pending 상태가 되기 때문에
PVC를 사용하기 위해서는 사용자가 직접 PV와 PVC를 생성해줘야함.
주의) PVC를 생성할 경우 values.yaml 파일에서 생성한 PVC이름을 넣어줘야함.
하지만 Test 환경이기에 예제에서는
empty 형식의 Volume을 사용하기 위해 설정을 변경하는 작업을 진행함.
[values.yaml 파일 수정]
alertmanager 와 Prometheus-Server 의 Volume 설정은
default는 아래그림 처럼 enabled: true 설정이 되어서
alertmanager 와 Prometheus-Server Deployment에서 Volume을
PVC로 바라보게 되어있는데
아래와 같이 해당 설정을 false로 변경한 후 저장
[default 상태]
(alertmanager 설정)
(Prometheus-Server설정)
[변경 후 상태]
(alertmanager 설정)
(Prometheus-Server설정)
3. Prometheus Service 설정 변경
Prometheus를 Web으로 확인하기 위해서
외부에서 Prometheus Server로 붙을 수 있어야하는데
해당 Service Object에 대한 설정이 아래 그림과 같이
Default로 ClusterIP로 되어있음.
[values.yaml 파일 수정]
(alertmanager 설정)
(Prometheus-Server설정)
해당 설정을 NodePort로 아래와 같이 변경 해줘야함
예제 환경에서는
alertmanager의 nodePort 를 30005로
Prometheus-Server의 nodePort 를 30006으로 지정함.
(alertmanager 설정)
(Prometheus-Server 설정)
4. Prometheus 설치
[명령어]
(helm version 2의 경우)
helm install -f values.yaml stable/prometheus --name prometheus --namespace prometheus
(helm version 3의 경우)
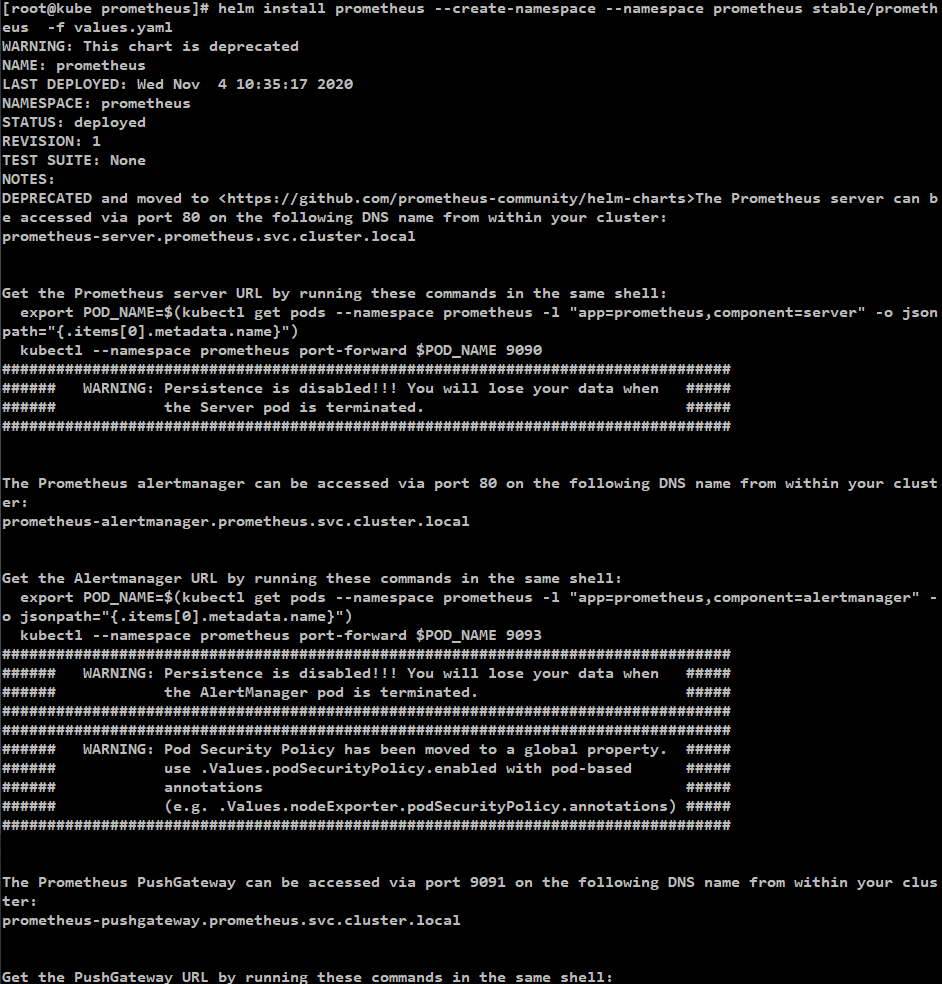
helm install prometheus --create-namespace --namespace prometheus stable/prometheus -f values.yaml
(참고 : Prometheus helm 삭제 명령)
helm delete prometheus --namespace prometheus stable/prometheus
[결과]
PVC를 사용하지 않고 Prometheus를 설치했기 때문에 그에 해당하는 WARING이 표시되고
PSP 설정이 On되어있지 않아서 WARING 이 있지만
Test환경이기에 무시하고 사용해봄.
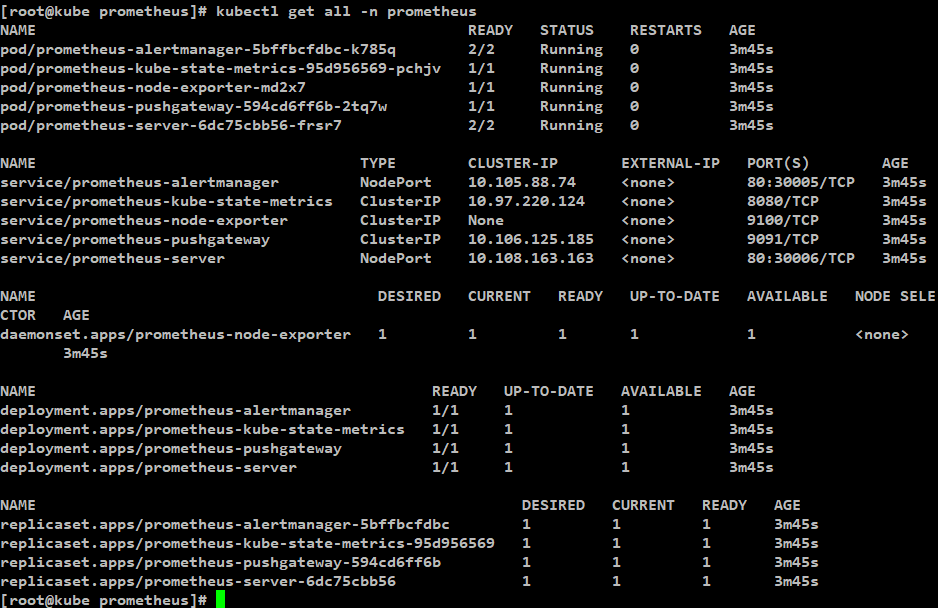
생성 확인 결과 : 정상
Prometheus Web UI로 확인해보기
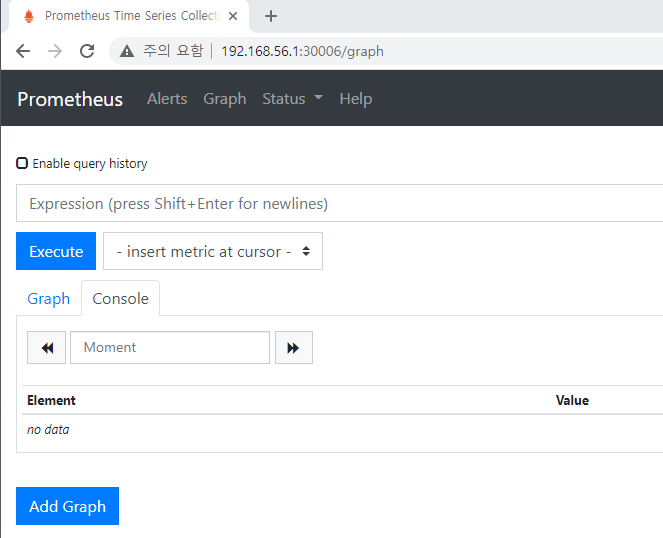
1. Prometheus Web UI 접속
service/prometheus-server 에 설정되어있는것 처럼
30006번 Port로 worker node 혹은 master Node의 IP로 붙어보면
Prometheus Web UI를 확인해볼 수 있음.
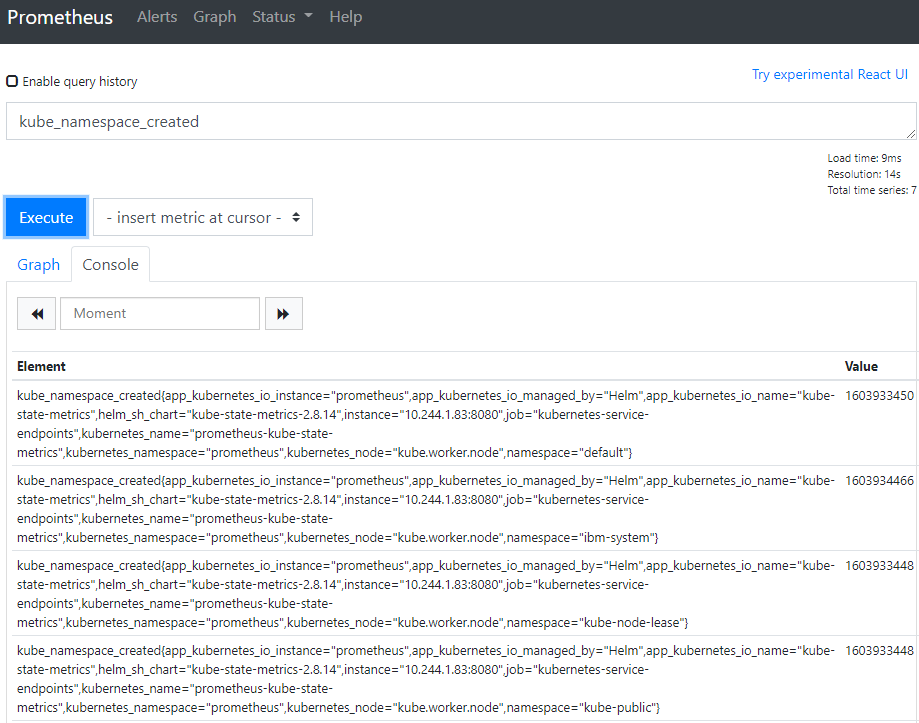
2. 확인하고자 하는 log 설정
해당창에서 Enable query history 부분에
확인을 원하는 명령문을 입력하면
Log를 확인할 수 있음
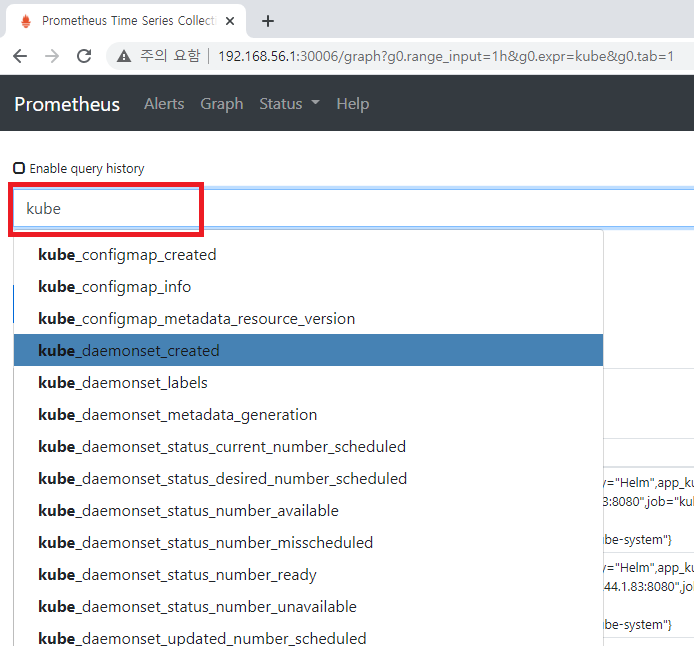
예제로 namespace create 정보를 확인할 결과.
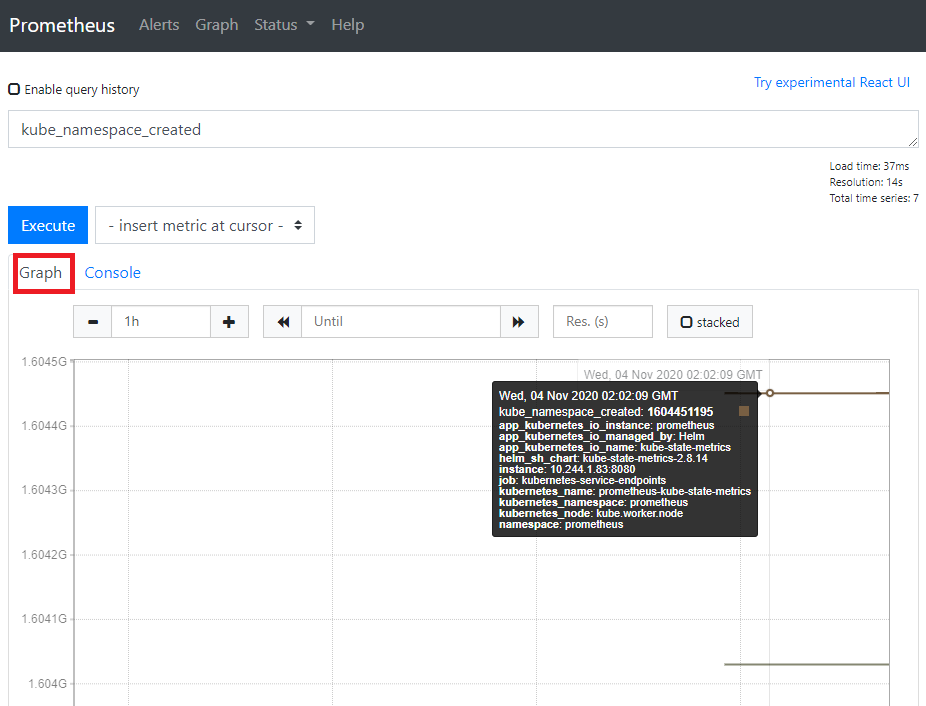
3. Graph로 확인해보기
Graph를 클릭하면 아래와 같이 시각화된 자료로 확인할 수 있음
제 글을 복사할 시 출처를 명시해주세요.
글에 오타, 오류가 있다면 댓글로 알려주세요! 바로 수정하겠습니다!
Prometheus 설치 참고
https://twofootdog.tistory.com/17
'Kubernetes > Monitoring' 카테고리의 다른 글
| kubernetes kubelet cAdvisor 분석 (0) | 2021.07.17 |
|---|---|
| Kubernetes Monitoring : Grafana (0) | 2020.11.07 |
| Kubernetes Monitoring : Prometheus 개념 (0) | 2020.11.07 |
| Kubernetes Monitoring : HPA (0) | 2020.11.07 |
| Kubernetes Monitoring : Metrics (0) | 2020.11.07 |